


Upgrading The Investable Universe
The Buy-Hold-Sell List is here!

Today the Compounding Dividends Investable Universe gets an upgrade.
The Buy-Hold-Sell list has arrived!

Our Universe
Have you looked at The Compounding Dividends Investable Universe yet?
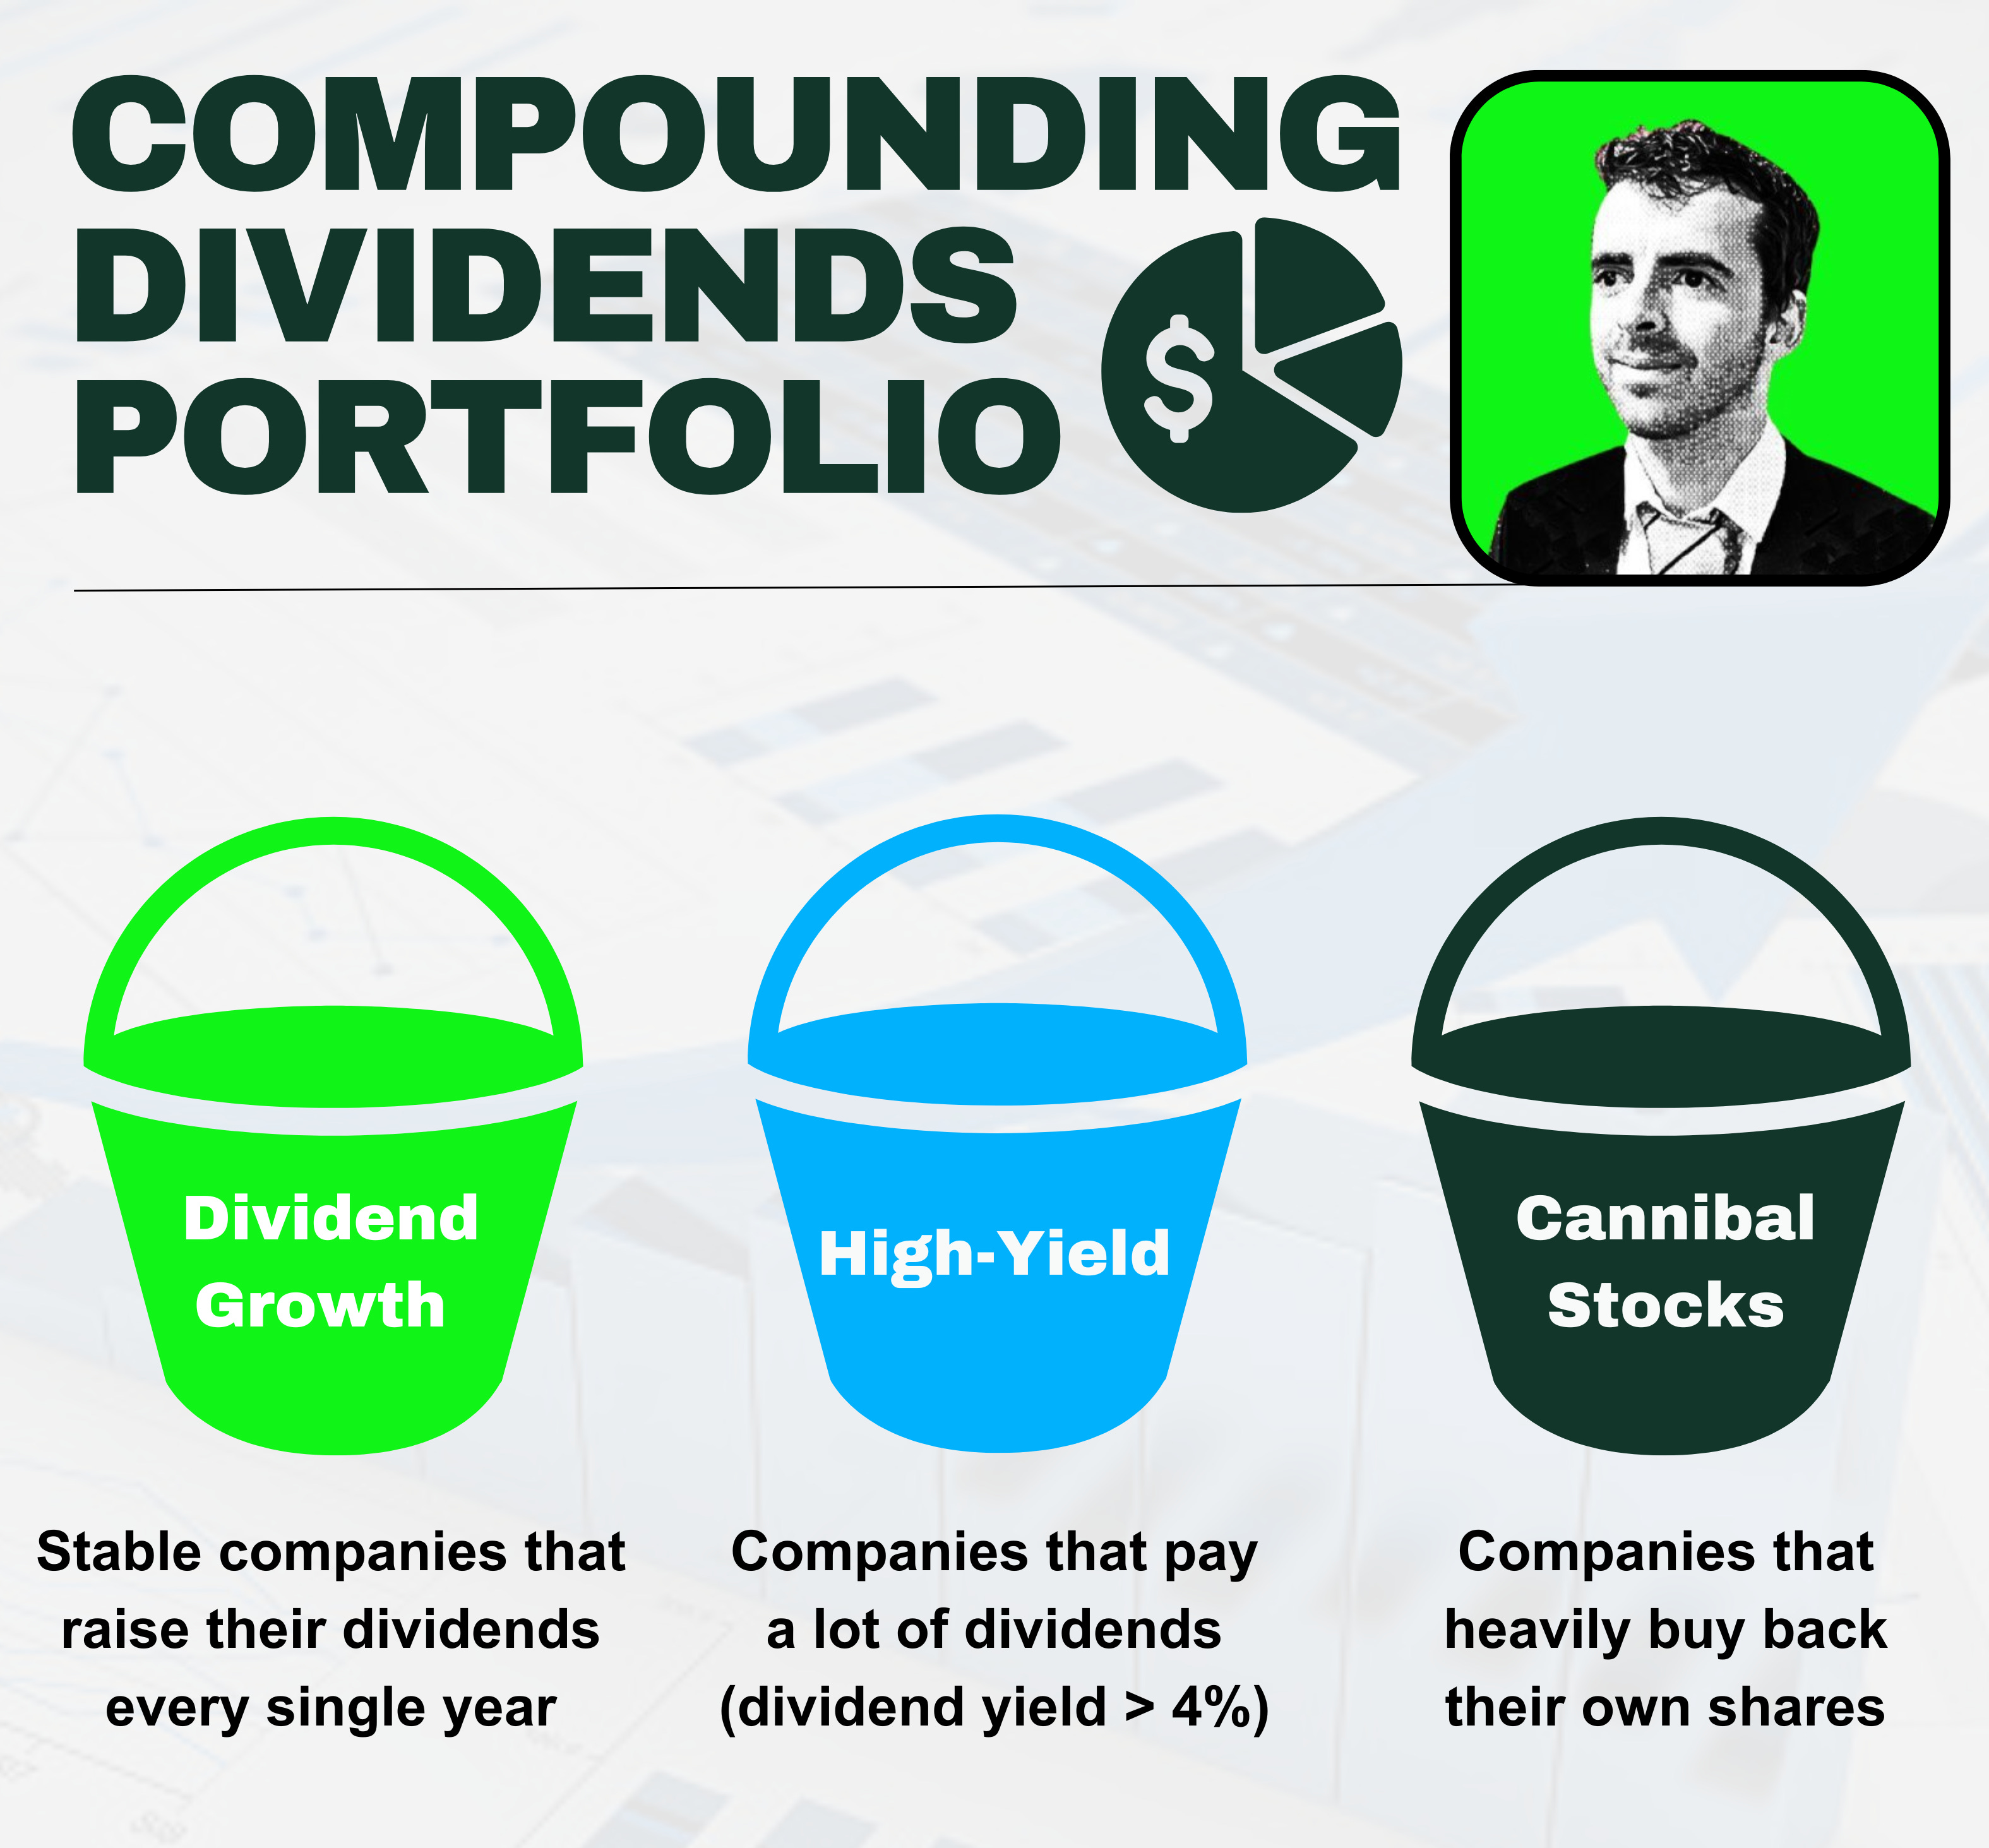
It contains over 800 stocks in 3 categories:
Dividend Growth Stocks: Stable companies that raise their dividends every year
High-Yield Stocks: Companies that return a lot of capital as dividends
Cannibal Stocks: Companies that heavily buy back their own shares
This is the list of companies that we’ll build the Compounding Dividends Portfolio from.
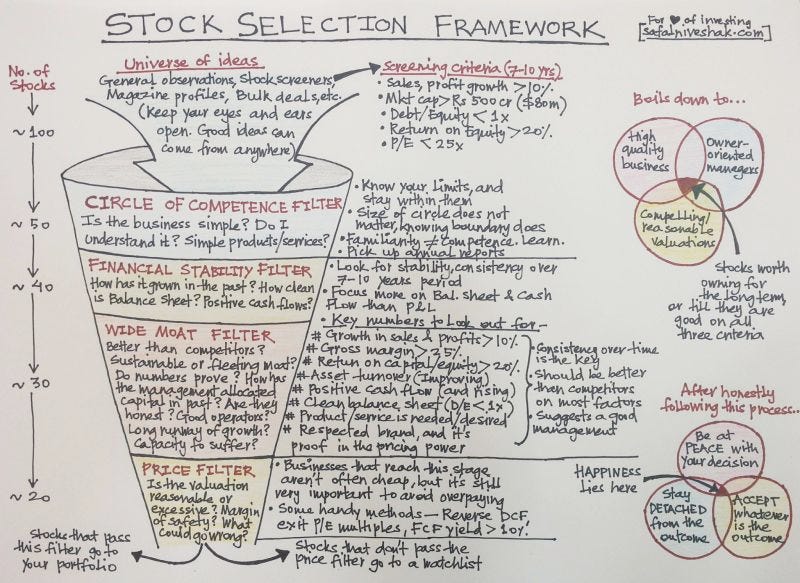
Selecting stocks is all about starting with good companies and saying “no” to all but the best.
Here’s a great example of how you should think about filtering out stocks:
The Challenge
Creating a Buy-Hold-Sell list of 750 companies is a huge undertaking!
The Investable Universe is massive, how do you start?
I knew that analyzing and valuing each individual stock was too inefficient.
So I looked for a way to use the available data to efficiently create the list.
How the Buy-Hold-Sell List Works
The comparison of the current Dividend Yield to the Historical Yield and the Reverse Dividend Discount Model were easy to implement with a spreadsheet.
The Earnings Growth Model was the problem.
I tried several ways to make this work, but ultimately I wasn’t getting results I was happy with.
So it was replaced with one of Peter Lynch’s favorite metrics.

If you don’t know Peter Lynch, he is one of the most successful mutual fund managers ever.
He managed the Fidelity Magellan Fund for 13 years and returned more than 29% per year.
Introducing the PEG ratio
Peter Lynch often used the Price/Earnings to Growth or PEG ratio to value stocks.
Here’s the formula:
PEG Ratio = P/E ratio / Earnings Growth Rate You can pay a higher P/E multiple for stocks that are growing earnings faster.
Here are the PE ratios you could have paid in 1973 to achieve a 7% return per year in 2019.
You could have paid more than 200 times earnings for Lindt, Altria and L’Oréal!
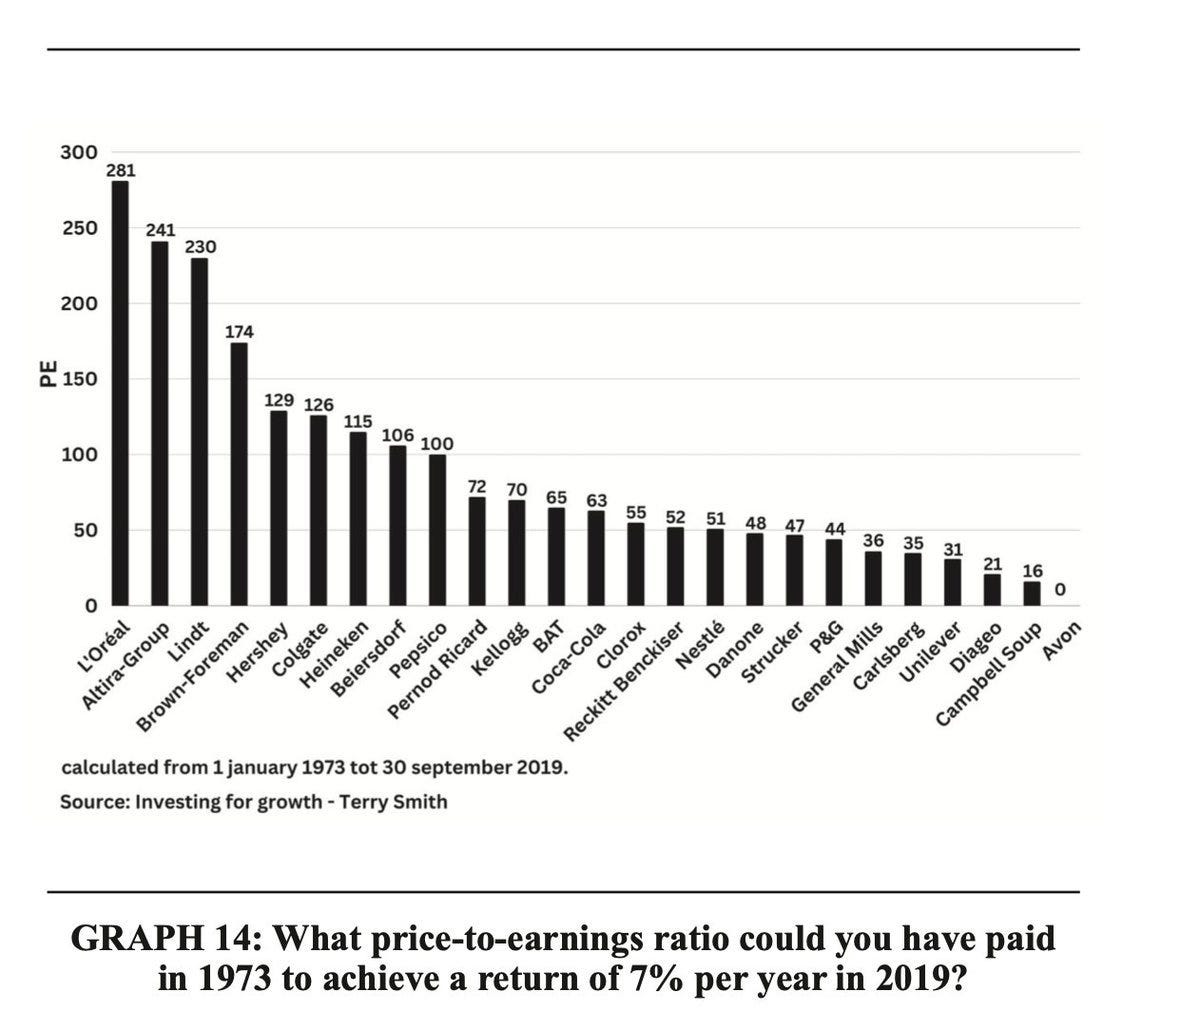
The beauty of the PEG ratio is that it takes this into account.
It also works very well for our Cannibal companies who are growing EPS through both the growth of the company and buybacks.
The spreadsheet uses the current P/E ratio, dividend by the consensus analysts’ EPS growth rate for the next 3 to 5 years.
Here’s how to interpret it:
PEG < 1: Indicates possible undervaluation - these are colored green in the list
PEG 1-2: The stock is fairly valued - these are yellow
PEG >2: The stock is overvalued - these are red
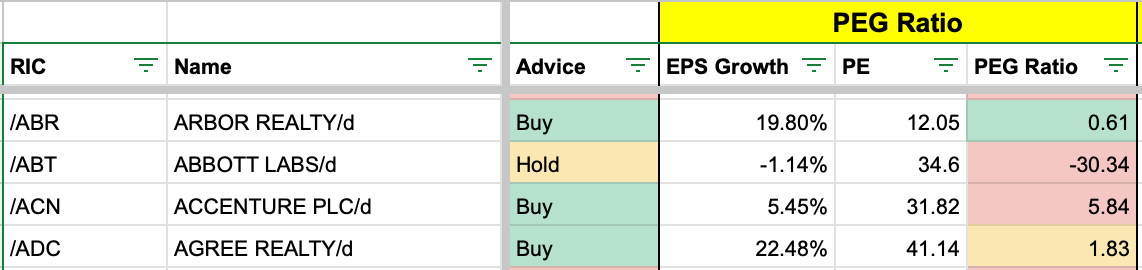
One caution
If the projected growth is negative - like with Abbott Labs, the PEG ratio will show up as negative - this should not be taken as an indication of undervaluation.
Dividend Yield
This method should be familiar to you - we compare the current Dividend Yield to the Historical Average.
In this case, we’re using the average of the past 5 years.
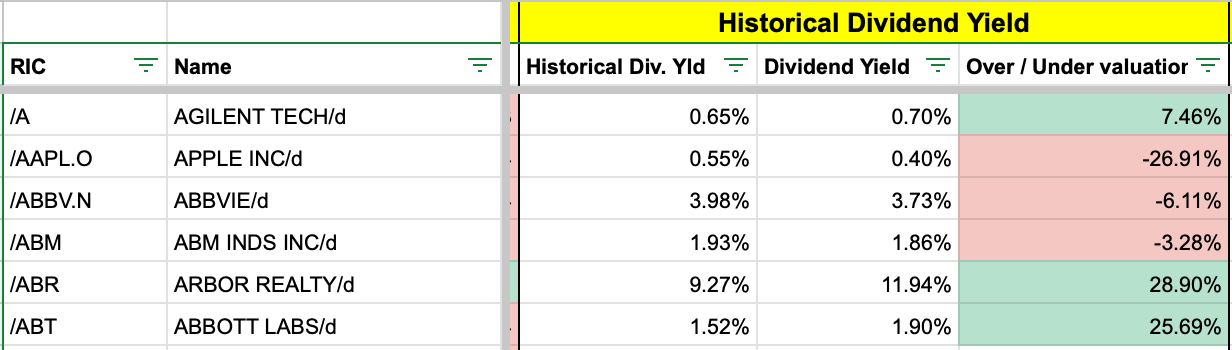
The Over/Undervaluation column shows you the difference between them.
A positive number in green indicates undervaluation.
A negative red number indicates overvaluation.
Reverse Dividend Discount Model
Finally, we have the Reverse Dividend Discount Model.
The Reverse DDM tells us how much dividend growth is priced into the stock.
We can then compare that with the historical Dividend Growth Rate
Here’s the formula:
Expected growth = Required return – (DPS next year / Current share price)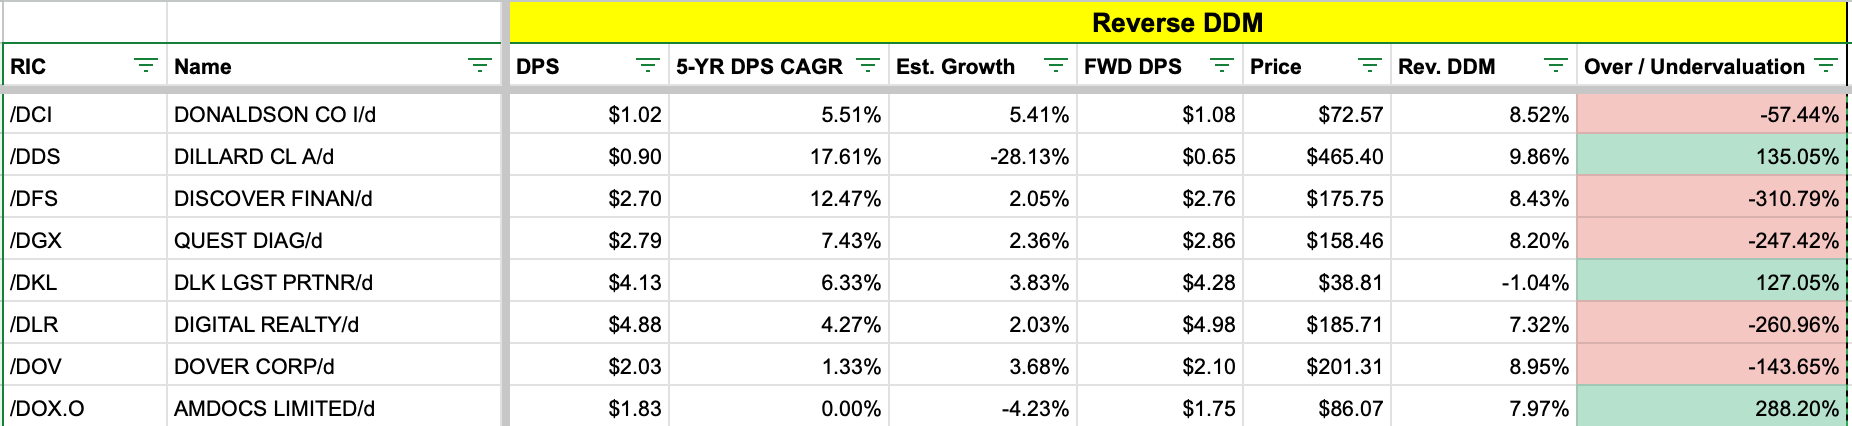
In this view we have:
The current Dividend Per Share
The 5-year average Dividend Growth Rate
The consensus growth rate of the dividend for the next year
The calculated forward dividend
The stock price
The Expected Growth calculated by the Reverse DDM
The Over or Undervaluation based on the Reverse DDM growth rate and the historical growth rate
The Final List
The entire Investable Universe contains more than 800 stocks.
The Buy-Hold-Sell list was updated after the market close on Friday.
As of today, 354 of them have a ‘Buy’ rating.
Are you ready to find out what they are?