Abbott Laboratories is a Dividend Aristocrat with a long history.
Founded in 1888, Abbott has been paying a dividend for 100 years (!) in a row.
An investment of $10,000 has turned into more than $328,000 since 1990.
Let’s teach you everything you need to know about this company.
General Information
👔 Company name: Abbott Laboratories
✍️ ISIN: US0028241000
🔎 Ticker: ABT
📚 Type: Dividend Aristocrat
📈 Stock Price: $104
💵 Market cap: $180.83 billion
📊 Average daily volume: $638.2 million
This was a guest post from TJ Terwilliger. Make sure to check out his Substack.
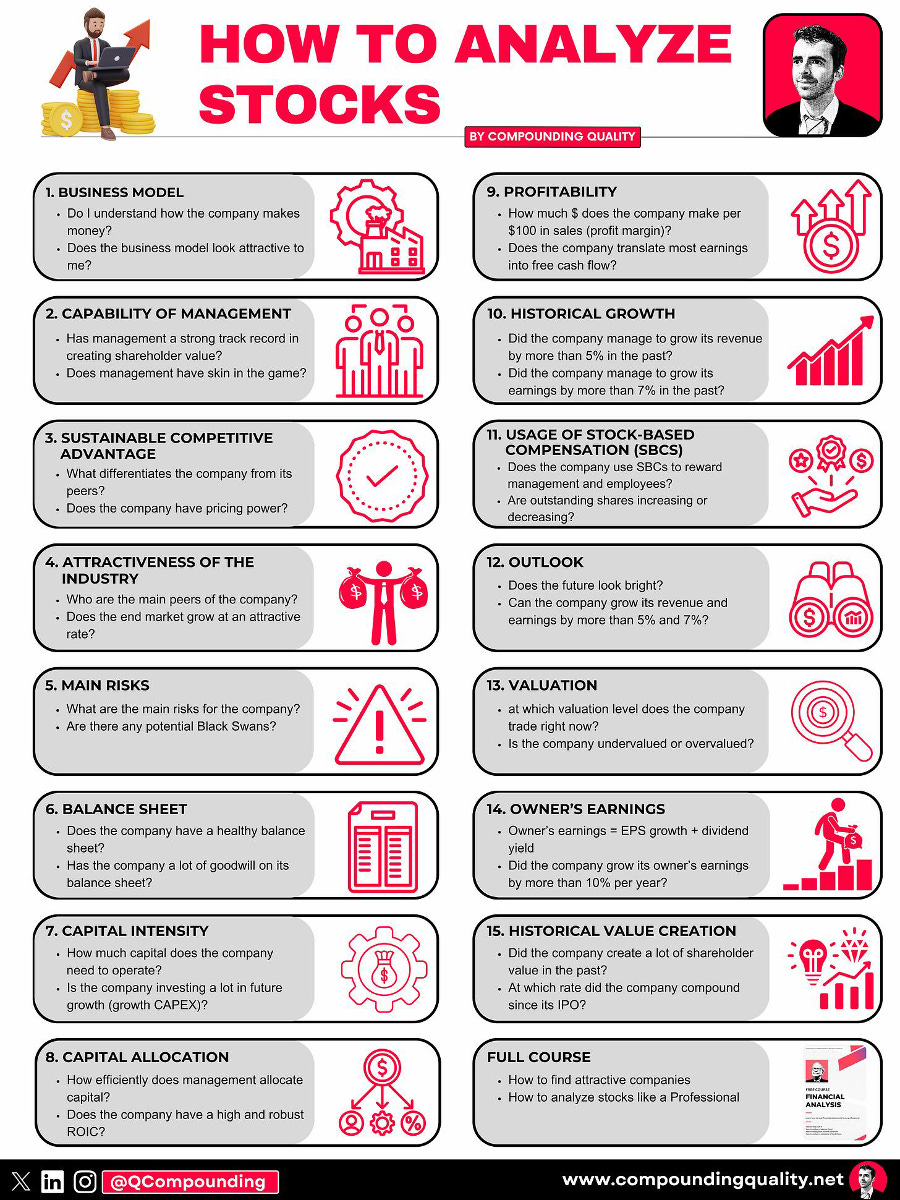
15-Step Approach
Now let’s use our 15-step approach to analyze the company.
1. Do I understand the business model?
Abbott Laboratories was founded in 1888 and is based in North Chicago, Illinois. Abbott sells a broad line of medical products, with more than half of their sales coming from outside the United States. They sell to both consumers and healthcare institutions like hospitals and nursing homes.
Abbott operates in four segments: Established Pharmaceutical Products, Diagnostic Products, Nutritional Products, and Medical Devices.
The Established Pharmaceutical Products segment (12.5% of sales) includes a broad line of branded generic pharmaceuticals manufactured worldwide and marketed and sold outside the United States in emerging markets.
The Diagnostic Products segment (25% of sales) includes a broad line of diagnostic systems and tests manufactured, marketed, and sold worldwide. Abbott offers laboratory systems, molecular diagnostics systems, cartridges for testing blood, rapid diagnostics, point-of-care testing for things like HIV, SARS-CoV-2, influenza, RSV, and strep A, remote patient monitoring, as well as informatics and automation solutions for laboratories.
The Nutritional Products segment (20.5% of sales) provides pediatric and adult nutritional products sold worldwide. This portfolio includes infant formulas like Similac, child and adult products like Ensure, Glucerna, and PediaSure, as well as nutritional products used in enteral (tube) feeding in healthcare settings.
The Medical Devices segment (42% of sales) offers rhythm management, electrophysiology, heart failure, vascular, and structural heart devices for the treatment of cardiovascular diseases; and diabetes care products, as well as neuromodulation devices for the management of chronic pain and movement disorders.
2. Is management capable?
Robert Ford has been the CEO since March of 2020 and was previously the Chief Operating Officer at Abbott. Before that he served as the Executive Vice President of Medical Devices, leading Abbott’s Diabetes Care, Cardiovascular and Neuromodulation businesses. He’s been with the company since 1996 (!).
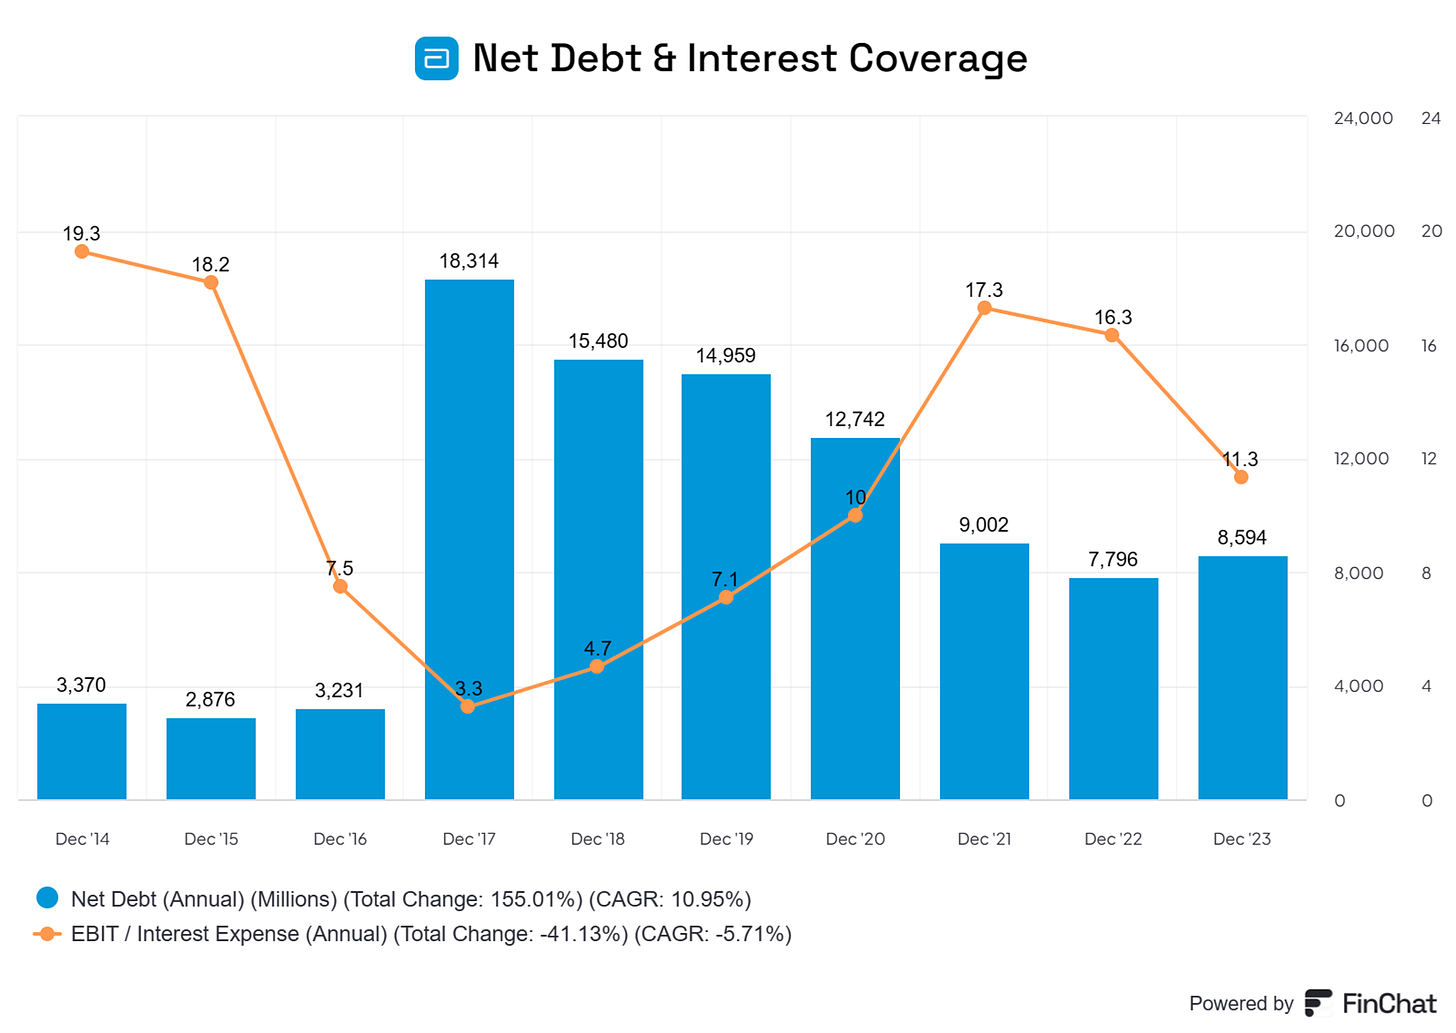
Since Mr. Ford took over in 2020, Abbott has increased their ROIC from 8.8% to 11.5% and reduced its Net Debt from $12.7 billion to $8.5 billion, indicating that management allocates capital well.
Mr. Ford owns around 250,000 shares in his name and holds another 197,000 in his family trust, meaning that he holds <1% of the company. This does mean that around $47 million of his wealth is invested in Abbott.
3. Does the company have a sustainable competitive advantage?
Abbott has well-known brands in both consumer and institutional products. You might recognize the names in Abbott’s consumer products segment: Similac, Glucerna, Ensure, and Pedialyte.
Using trusted brands from a trusted manufacturer is very important in healthcare. Nobody wants to use a pacemaker or laboratory test from a less-reputable brand to save a few dollars.
In addition, Abbott has leadership positions across many of its business segments and in multiple geographies. This requires presence in these markets to meet the local needs and preferences of key stakeholders, including hospitals, physicians, pharmacies and consumers.
These relationships are difficult for competition to replicate and require complex supply chains, giving Abbott further advantages over competitors.
Companies with a sustainable competitive advantage are often characterized by the following:
Gross Margin: 55% (Gross Margin > 40%? ✅)
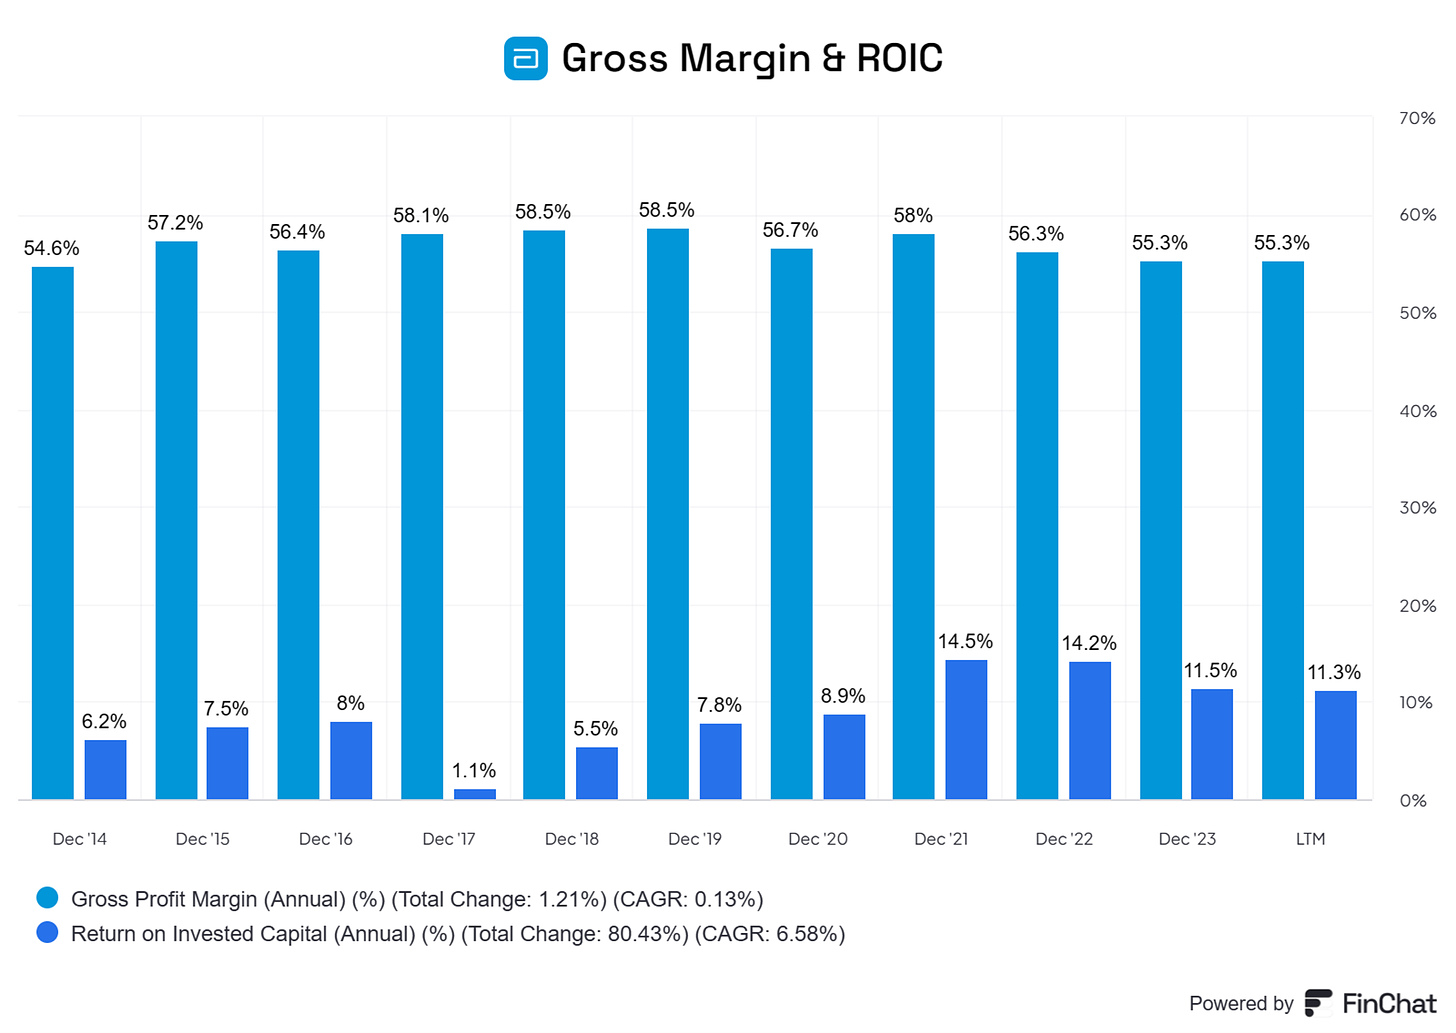
ROIC: 11.3% (ROIC > 15%? ❌)
Source: Finchat
4. Is the company active in an attractive end market?
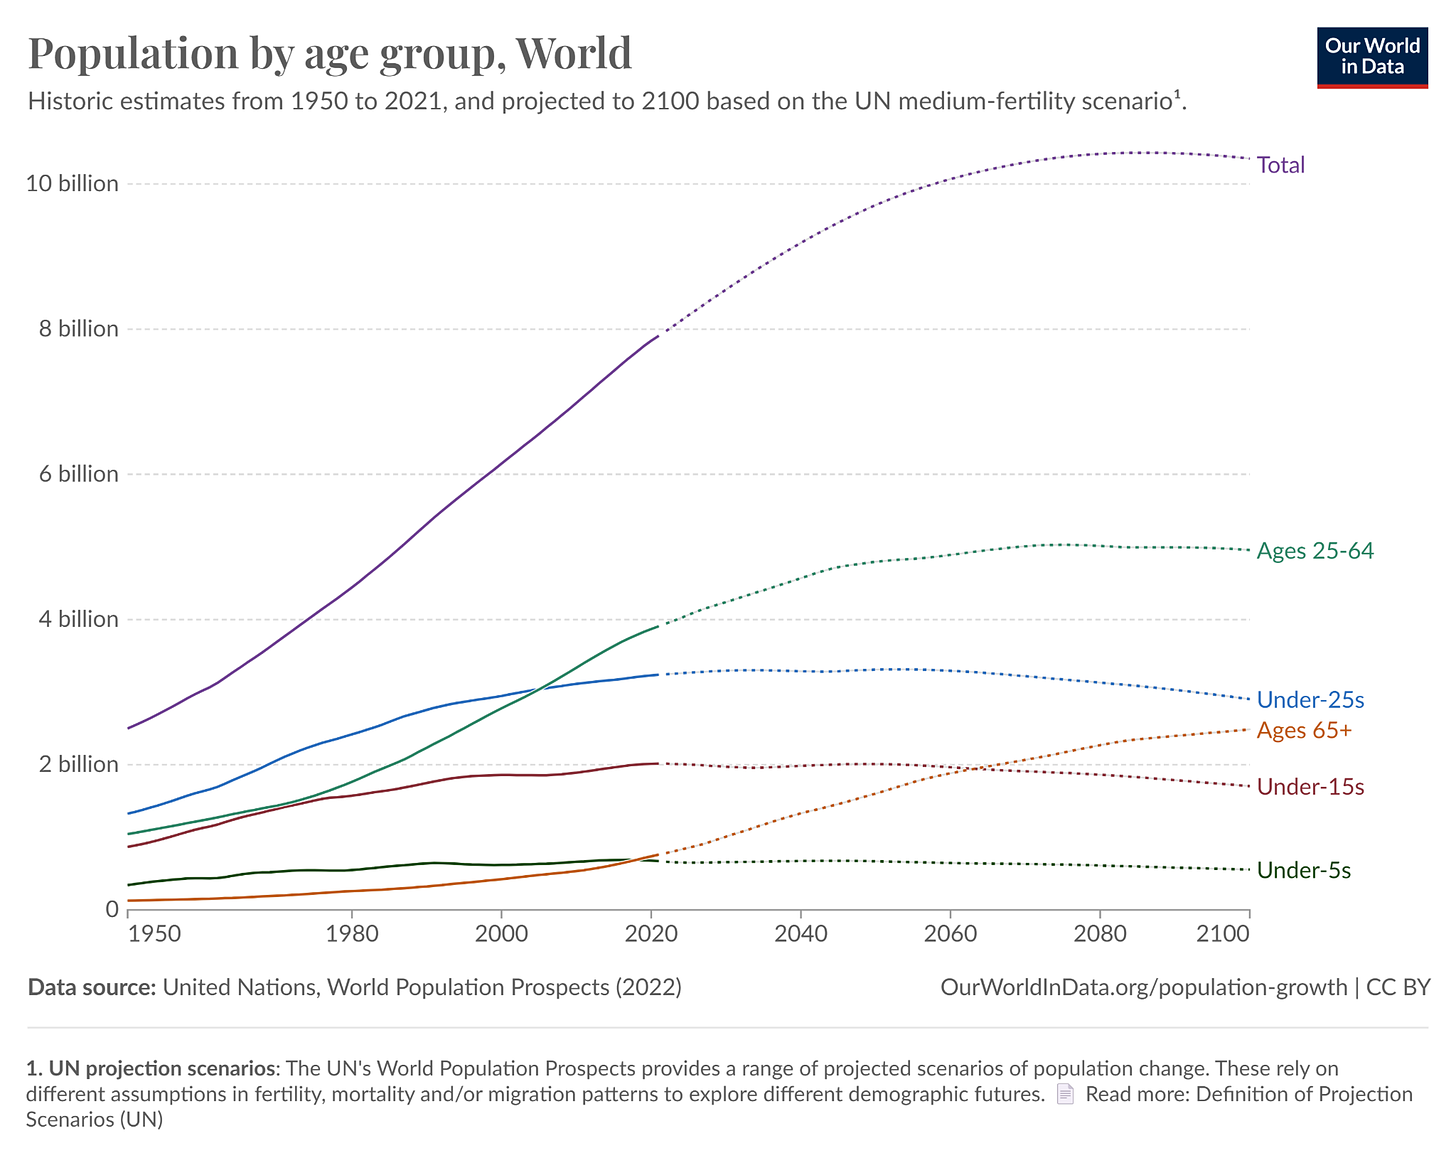
Abbott is active in an attractive end market. Healthcare spending is necessary and is less reliant on general economic conditions than many other markets. Abbott is also positioned to take advantage of our aging population - look at the age 65+ line on the graph below:
In addition to this large trend, more than half of Abbott’s sales come from outside the US.
Management says 50% of revenue comes from countries where healthcare spending is growing faster than gross domestic product (GDP).
5. What are the main risks for the company?
Some of the main risks for Abbott include:
Supply chain disruption - Abbott has a large, complex global supply chain.
Healthcare is heavily regulated. As Abbott is a global company, they’re subject to complex regulation in each market in which they operate
Abbott must continually invest in research and development, continuing to come out with new products to compete with other companies
Product failure or lawsuits could damage Abbott’s brand and reputation
6. Does the company have a healthy balance sheet?
We look at 3 ratios to determine the healthiness of Abbott’s balance sheet:
Interest Coverage: 11.3x (Interest Coverage > 15x? ❌)
Net Debt/FCF: 1.7 (Net Debt/FCF < 4x? ✅)
Goodwill/Assets: 44% (Goodwill/assets not too large? < 20% ❌)
Abbott’s balance sheet looks relatively healthy.
However, we’d like to see a bit higher interest coverage. Abbott also has a significant amount of goodwill on their balance sheet, much of this is from several large acquisitions in 2017 to expand their cardiovascular and point-of-care diagnostics portfolios.
Source: Finchat
7. Does the company need a lot of capital to operate?
We prefer to invest in companies with a CAPEX/Sales lower than 5% and CAPEX/Operating Cash Flow lower than 25%.
Abbott:
CAPEX/Sales: 5.4% (CAPEX/Sales < 5%? ❌)
CAPEX/Operating Cash Flow: 30% (CAPEX/Operating CF? < 25% ❌)
The capital intensity of Abbott is a bit higher than we’d like. However, considering that it is a company that manufactures healthcare products, these numbers don’t look too bad.
8. Is the company a great capital allocator?
Capital allocation is the most important task of management.
Look for companies that put the money of shareholders to work at an attractive rate of return.
Abbott:
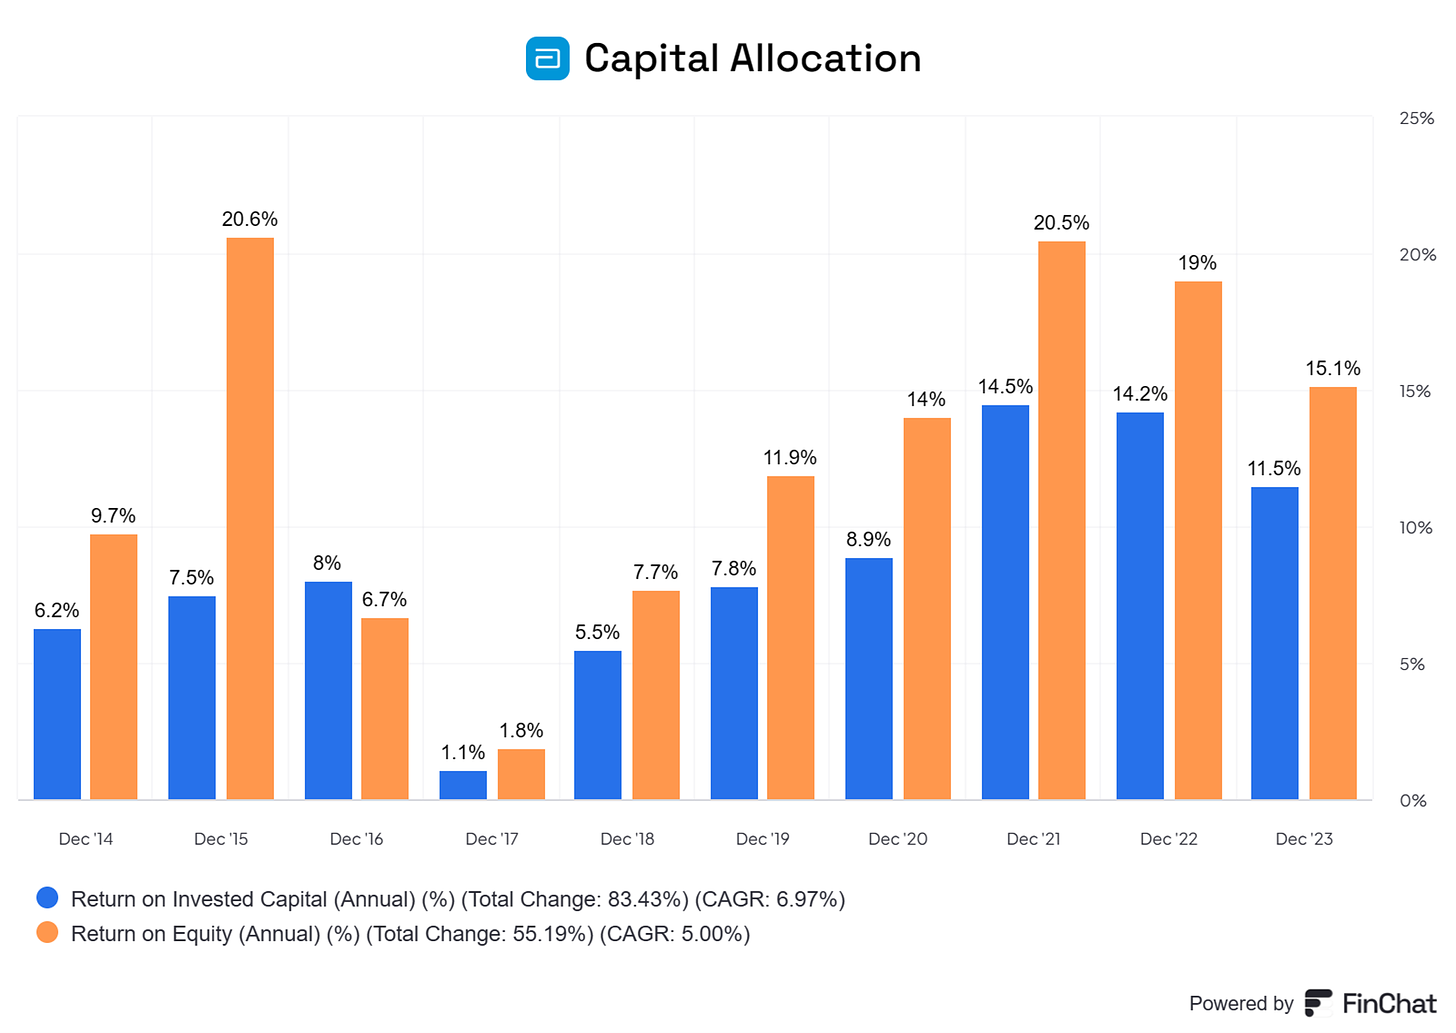
Return On Equity: 15% (ROE > 20%? ❌)
Return On Invested Capital: 11.5% (ROIC > 15%? ❌)
These numbers don’t look great, as we want the ROIC to be at least 15%.
However, when you exclude Abbott’s goodwill, the ROIC increases to 27%!
Here’s an evolution of Abbott’s ROE and ROIC:
Source: Finchat
9. How profitable is the company?
The higher the profitability of the company, the better.
Here’s what things look like for Abbott:
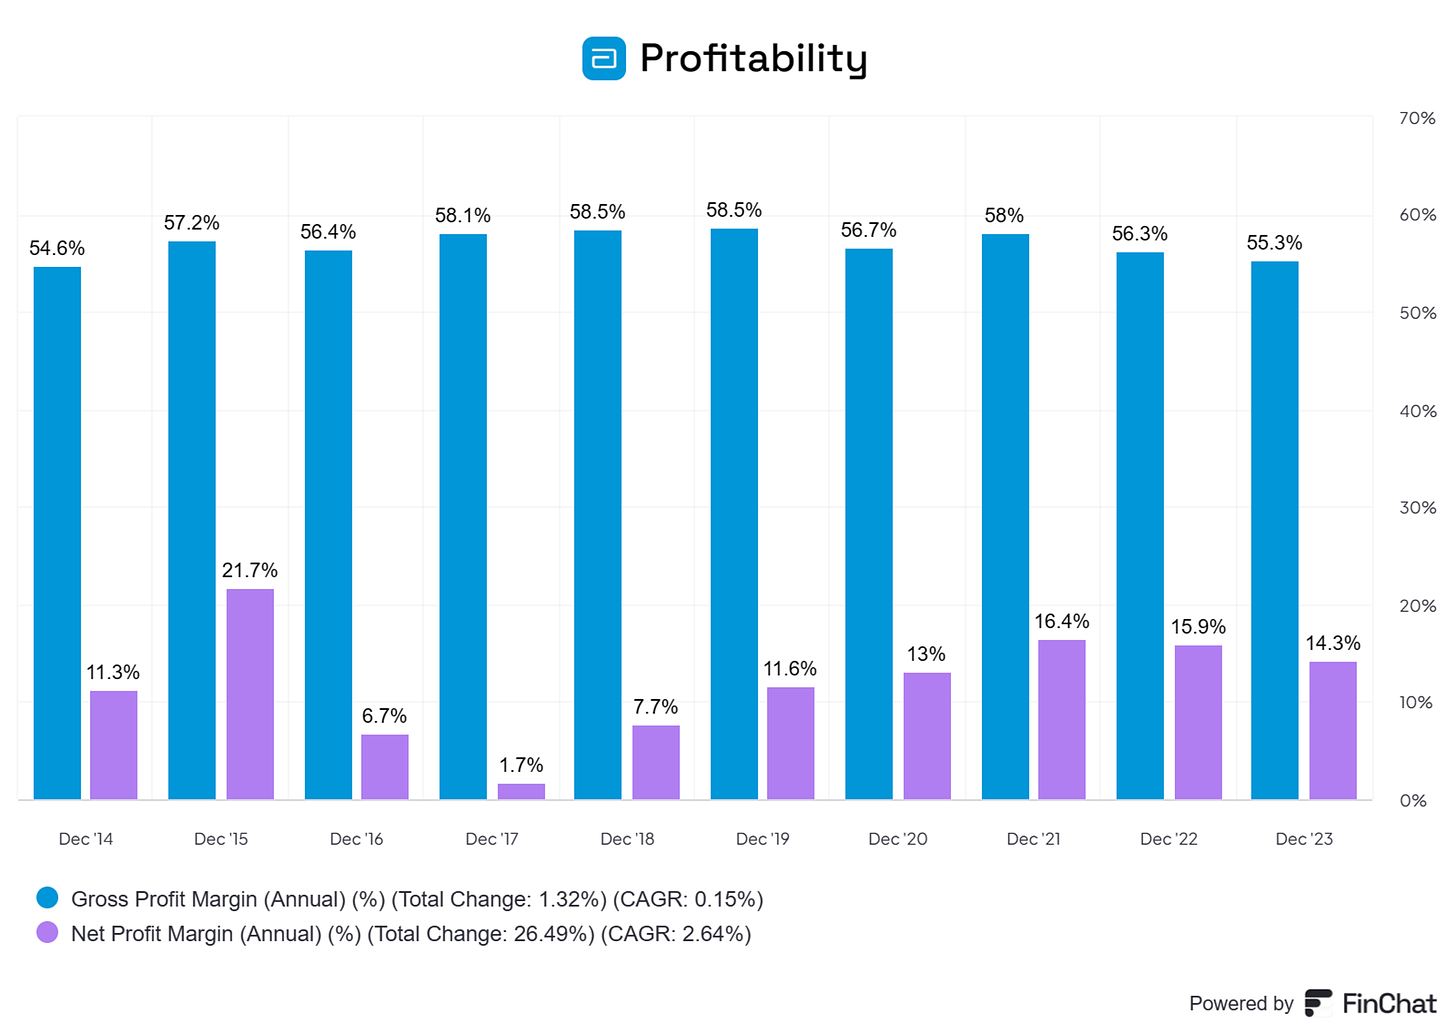
Gross Margin: 55.3% (Gross Margin > 40%? ✅)
Net Profit Margin: 14.3% (Net Profit Margin > 10%? ✅)
FCF/Net Income: 88.4% (FCF/Net Income > 80%? ✅)
Source: Finchat
Abbott is a profitable company, with relatively stable margins over time.
10. Does the company use a lot of Stock-Based Compensation?
Stock-based compensation is a cost for shareholders and should be treated accordingly.
We want to see SBCs as a % of Net Income to be lower than 4%.
We consider SBCs as a % of Net Income higher than 10% as a bad thing.
Abbott:
SBCs as a % of Net Income: 11.25% (SBCs/Net Income < 10%? ❌)
Avg. SBC as a % of Net Income past 5 years: 10.8% (SBCs/Net Income < 10%? ❌)
Abbott uses more stock-based compensation than we like to see.
We will take this into account in our valuation model and risks to the company.
11. Did the company grow at attractive rates in the past?
We’re looking for companies that have grown their revenue and EPS by at least 5% and 7% per year respectively.
Abbott:
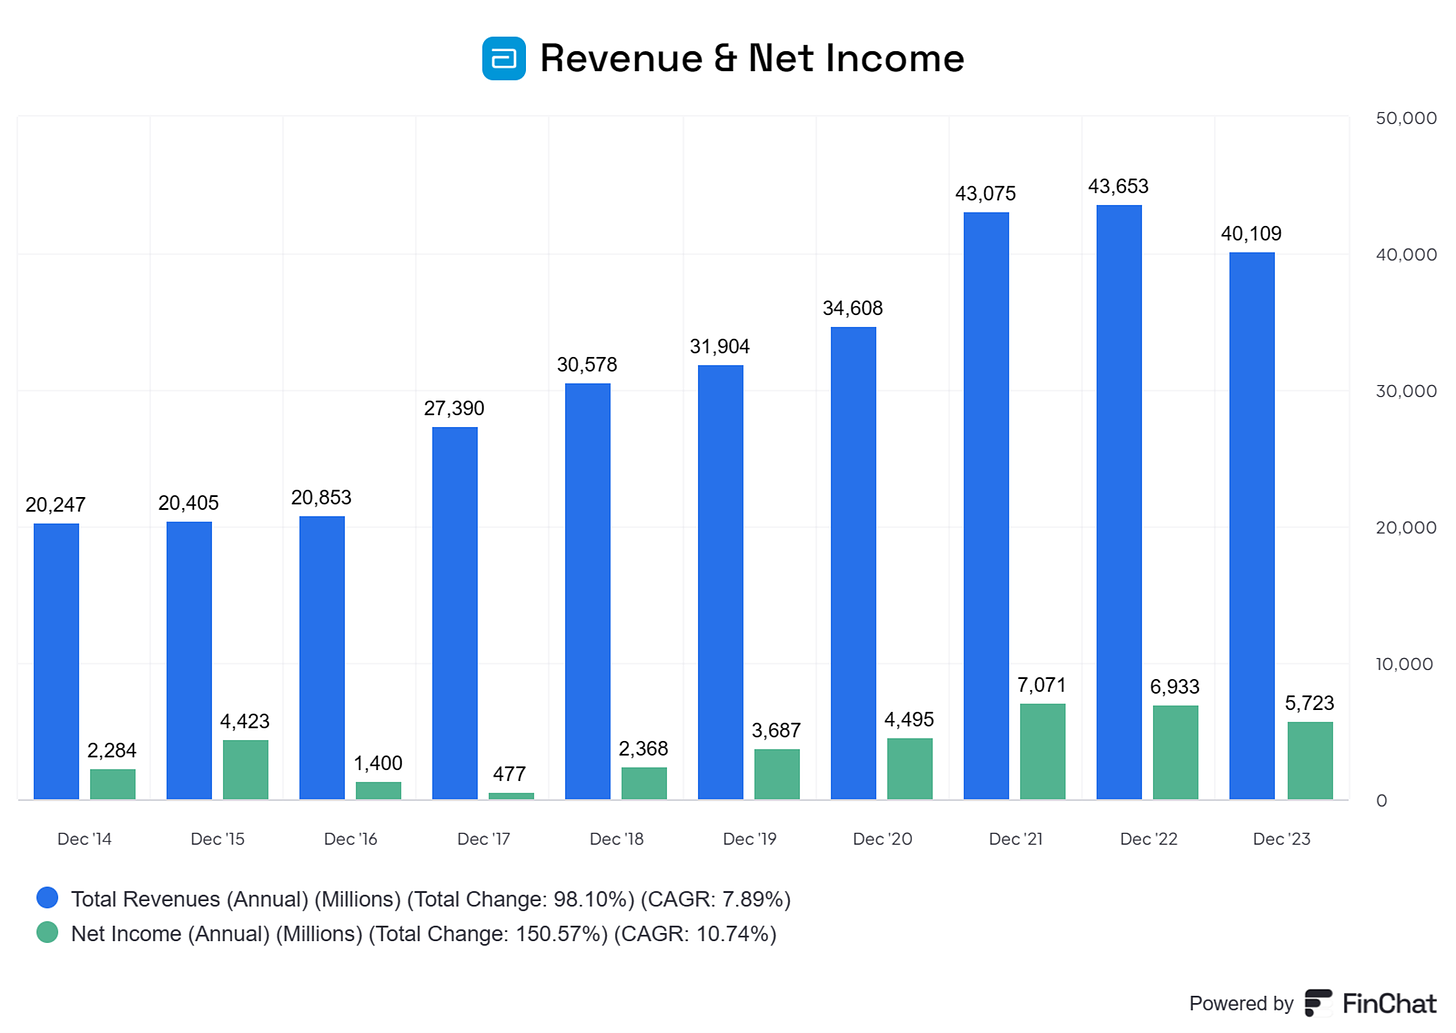
Revenue Growth past 5 years (CAGR): 5.6% (Revenue growth > 5%? ✅)
Revenue Growth past 10 years (CAGR): 7.8% (Revenue growth > 5%? ✅)
EPS Growth past 5 years (CAGR): 16.8% (EPS growth > 7%? ✅)
EPS Growth past 10 years (CAGR): 7.7% (EPS growth > 7%? ✅)
Source: Finchat
12. Does the future look bright?
We want to invest in companies that can continue to grow at attractive rates - stock prices tend to follow FCF per share growth over time.
Abbott:
Exp. Revenue Growth next 2 years (CAGR): 5.6% (Revenue growth > 5%? ✅)
Exp. EPS Growth next 2 years (CAGR): 7.4% (EPS growth > 7%? ✅)
Long-Term Growth Estimate EPS (CAGR): 6.5% (EPS growth > 7%? ❌)
While the next few years look attractive, we’d prefer to see the long-term growth estimate a bit higher.
13. Does the company trade at a fair valuation level?
We always use 3 methods to look at the valuation of a company:
A comparison of the forward PE multiple with its historical average
Earnings Growth Model
Reverse Discounted-Cash Flow
A comparison of the multiple with the historical average
The first thing we do is compare the current forward PE with its historical average over the past 5 and 10 years.
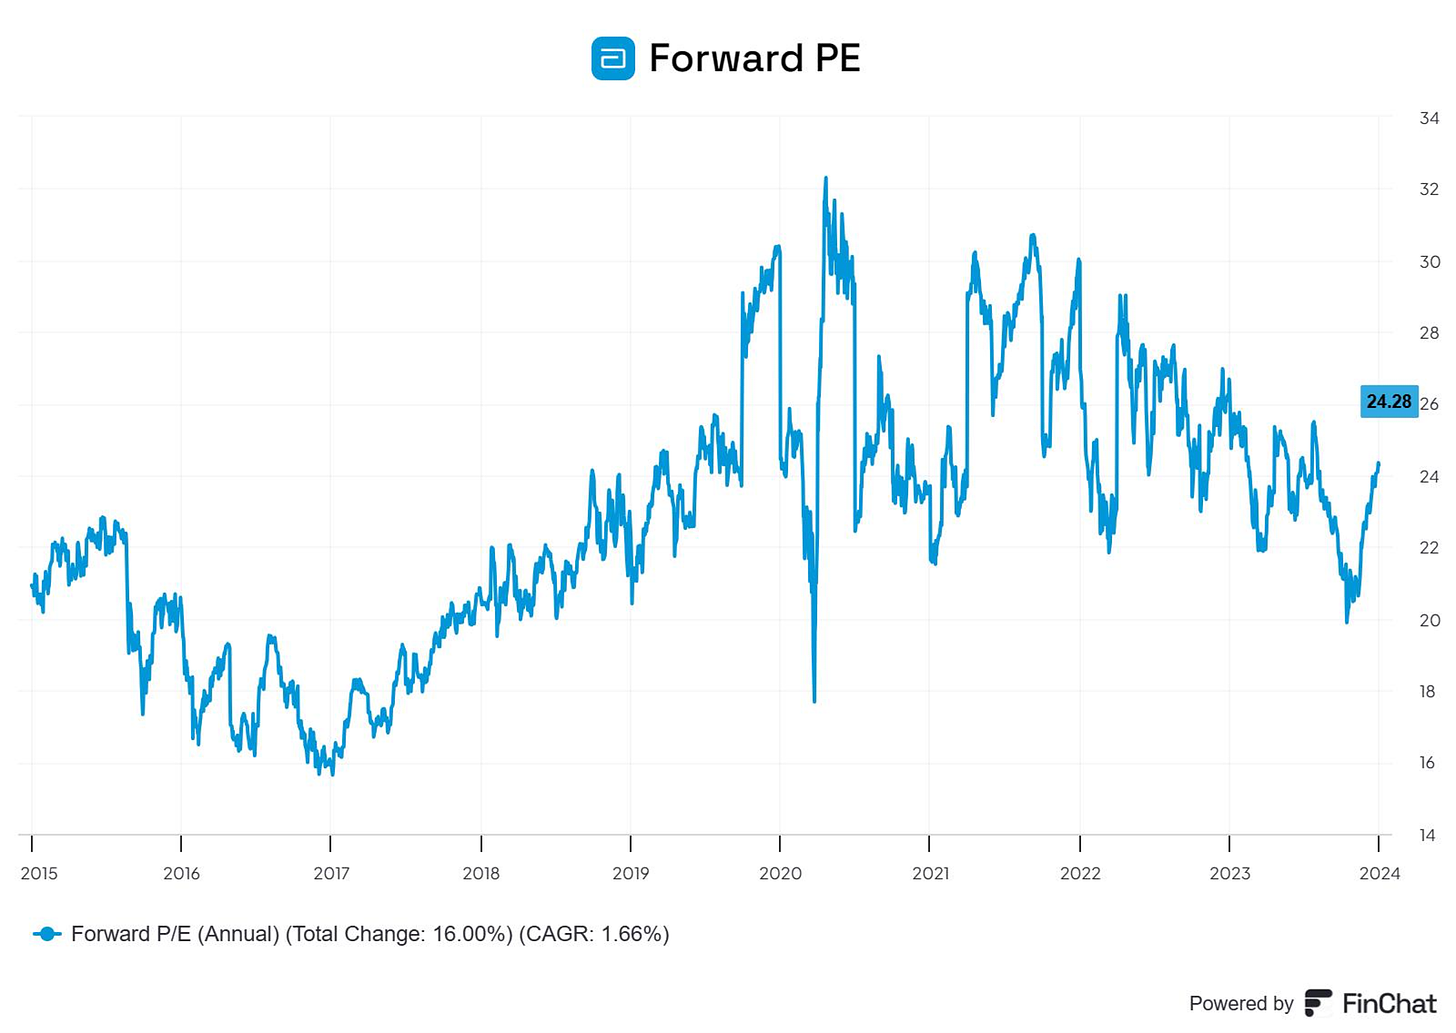
Today, Abbott trades at a forward PE of 24.3x versus a historical average of 36x over the past 5 years.
Source: Finchat
However, we should include stock-based compensation when looking at Abbott’s valuation (this isn’t taken into account in the chart above).
When you remove stock-based compensation, Abbott’s PE rises to 34.3x.
This looks much closer to Abbott’s average valuation over the past 5 years.
Earnings Growth Model
This model shows you the yearly return you can expect as an investor.
In theory, it’s easy to calculate your expected return:
Expected return = Earnings growth + Shareholder Yield +/- Multiple Expansion (Contraction)
Wherein Shareholder Yield = Dividend Yield + Buyback Yield
Here are the assumptions I’ve used:
Earnings Growth = 6.5% per year over the next 10 years
Shareholder yield = 2.5% (average of 1.75% dividend yield + 0.75% buyback yield past 5 years)
Forward PE to decline from 25x to 22x over the next 10 years
Expected yearly return = 6.5% + 2.5% - 0.1* ((22-25)/25))= 8.98%.
An expected yearly return of 8.98% is below our desired target of 10%.
Reverse DCF
Charlie Munger once said that if you want to find the solution to a complex problem, you should invert. Always invert. Turn the problem upside down.
A reverse DCF shows us the expectations implied in the current stock price.
We can then determine whether these expectations are realistic or not.
You can learn more about a reverse DCF here: Reverse DCF 101.
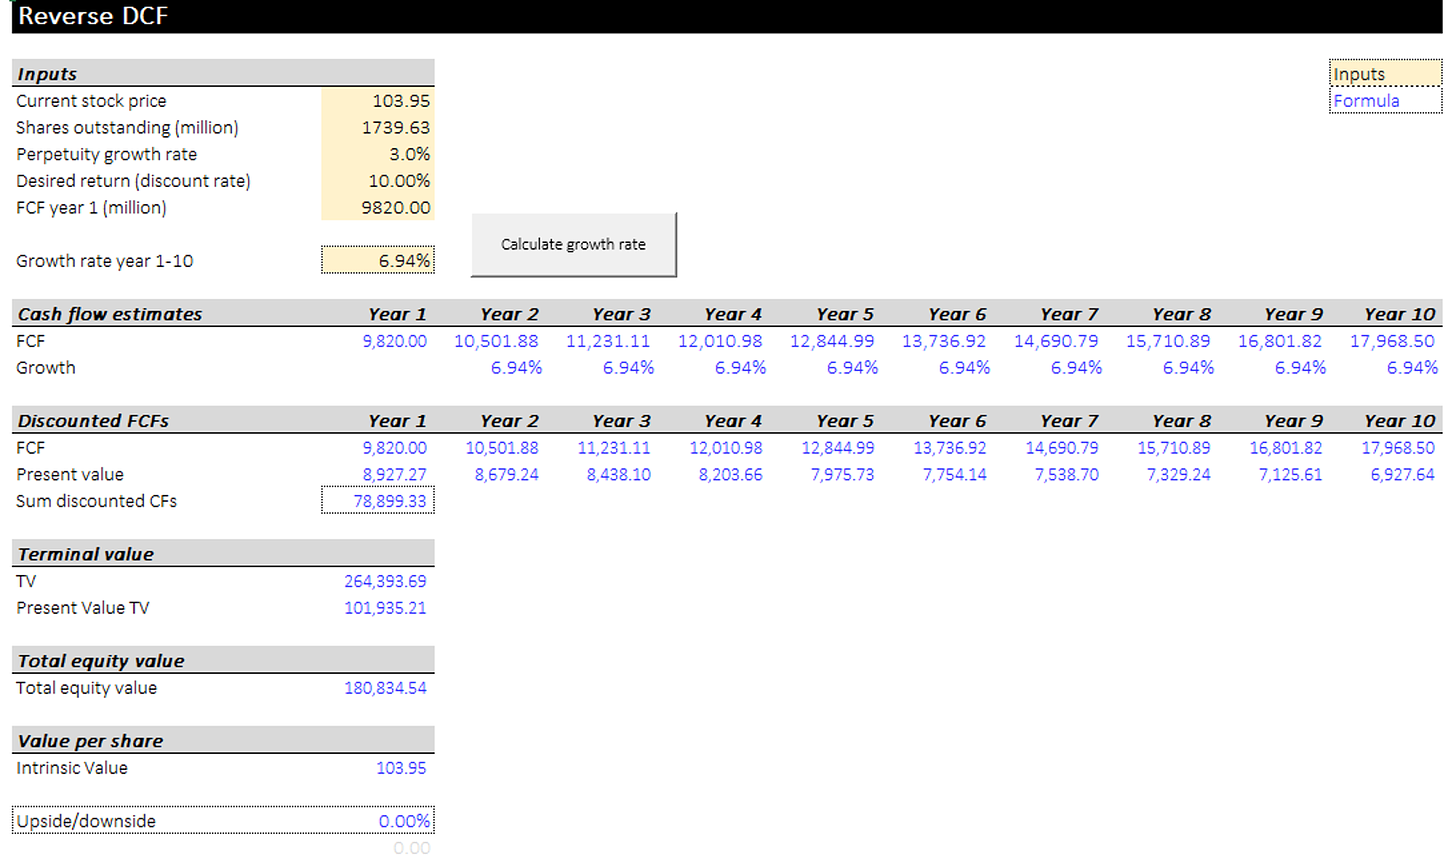
The consensus states that Abbott’s Free Cash Flow over the next 12 months will be $10.47 billion.
Because stock-based compensation is a real cost for shareholders, we’ll subtract the SBC of $650 million to arrive at a FCF of $9.82 billion in year 1.
Using these assumptions, our Reverse DCF indicates that Abbott should grow its Free Cash Flow by 6.94% per year to return 10% per year to shareholders.
This is in line with the expectations for Abbott in the coming years.
14. How have the Dividends of the company grown in the past?
As income investors, it’s important to look at the dividend history of a company.
Over time, we want to collect regular, and growing payments from the company.
We want to invest in companies that have a rich dividend history.
Attractive dividend growth
Reasonable dividend yield
Sustainable payout ratio
This is the case for Abbott.
Dividend Growth
Source: Finchat
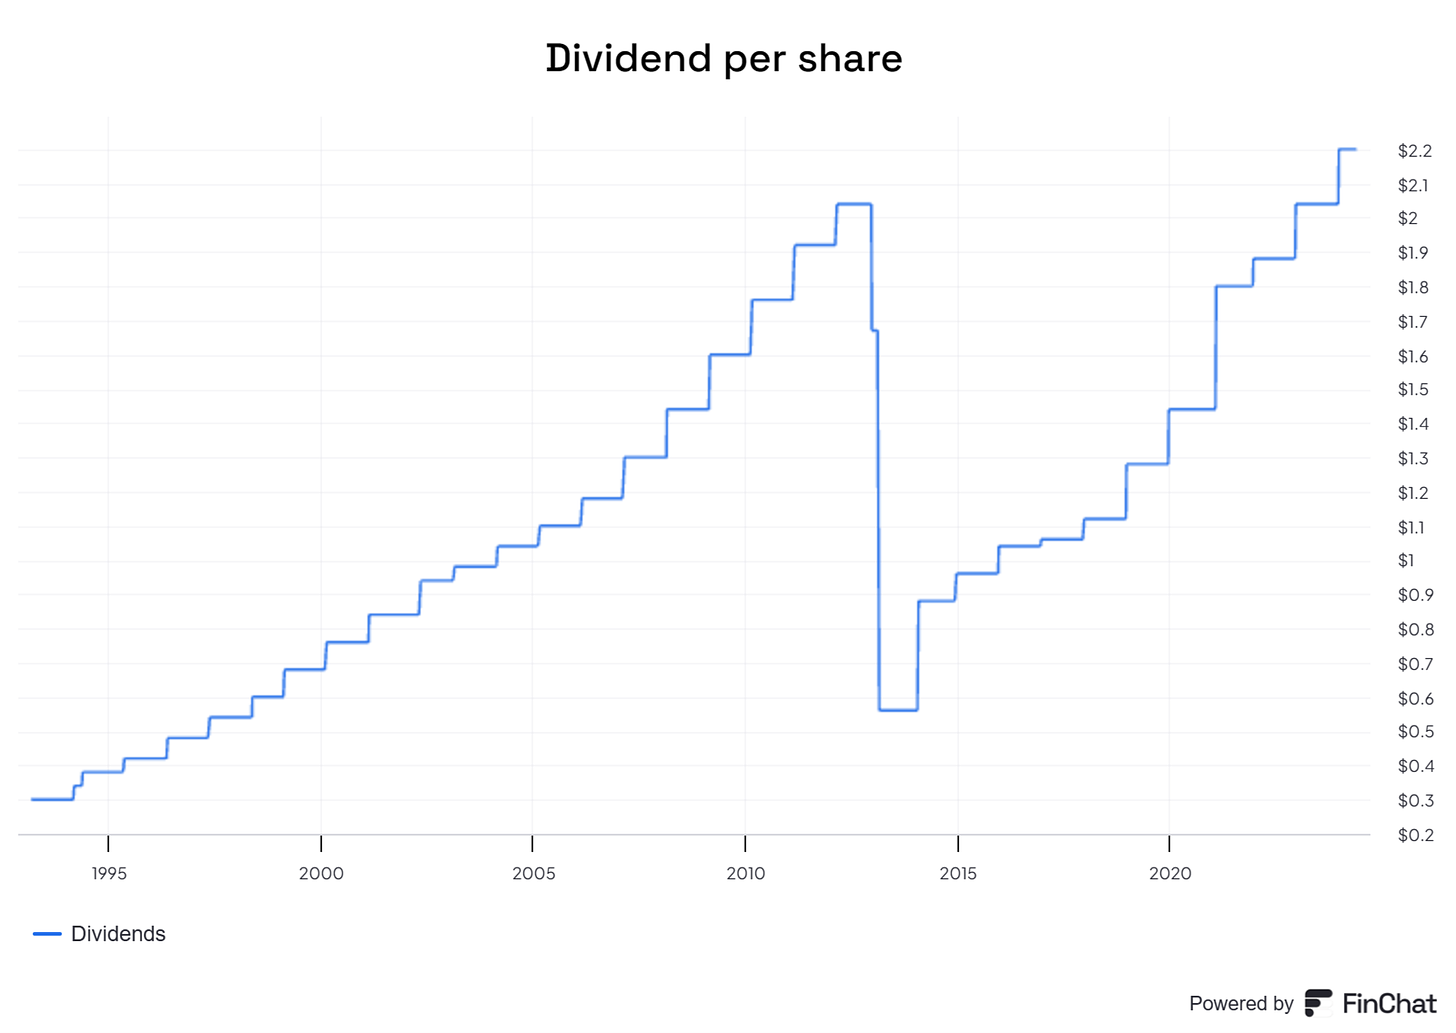
Abbot has continuously paid a dividend for 100 years (!). As you can see, they’ve increased their dividend per share consistently since 2014.
However, Abbott’s dividend history is even better than it appears in this chart.
On Jan. 1, 2013, Abbott separated its research-based pharmaceuticals business into a new company, called AbbVie. Taking this into account, Abbott has actually increased the dividend payout for 51 consecutive years (!).
Reasonable Dividend Yield
Abbott currently yields 2.12%, significantly above the 1.35% yield offered by the S&P 500.
The best part is that Abbott is still growing at 5% to 6% a year, so we can expect the dividend to do the same!
Sustainable payout Ratio
We don’t want the payout ratio to be too high. The company should be able to keep paying dividends in the future (and to grow them).
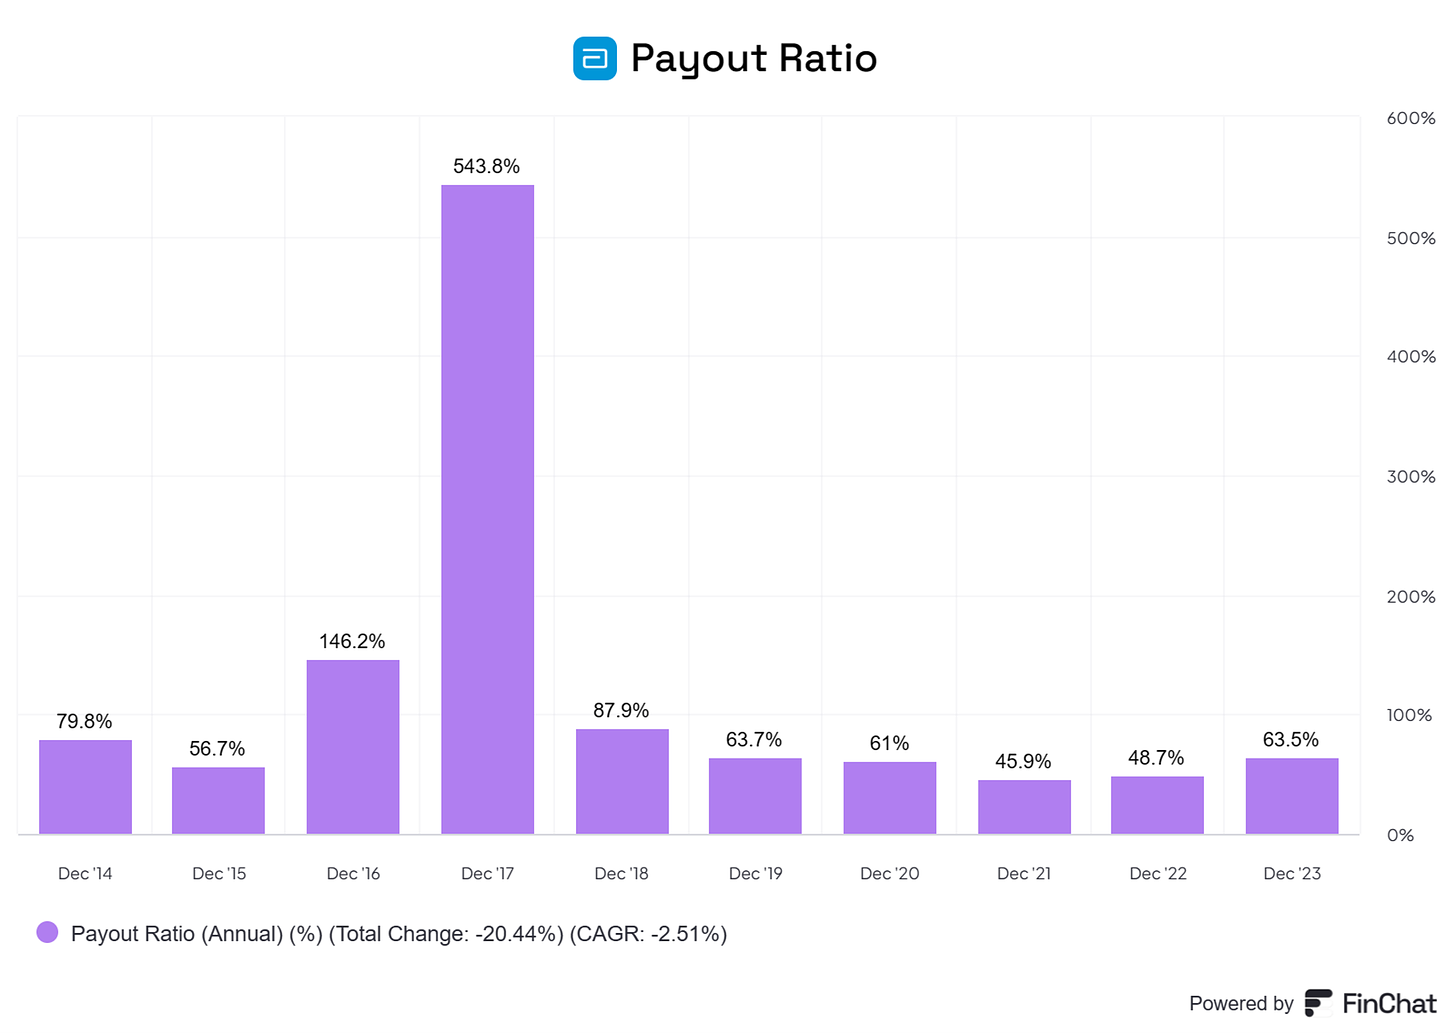
That’s why we look at the payout ratio. This is simply a ratio of dividends paid to net income. A ratio of over 100% indicates that a company is paying out more money than it is taking in and that the dividend might not be sustainable.
Abbott currently has a payout ratio of 65.76% - a nice balance between retaining some earnings for the company and returning some to shareholders.
Abbott has generally maintained a safe payout ratio in the past. (Remember that the spin-off of AbbVie affected the 2016 and 2017 numbers in the chart below.)
Source: Finchat
15. Did the company create a lot of shareholder value in the past?
We want to invest in companies that have managed to compound at attractive rates in the past.
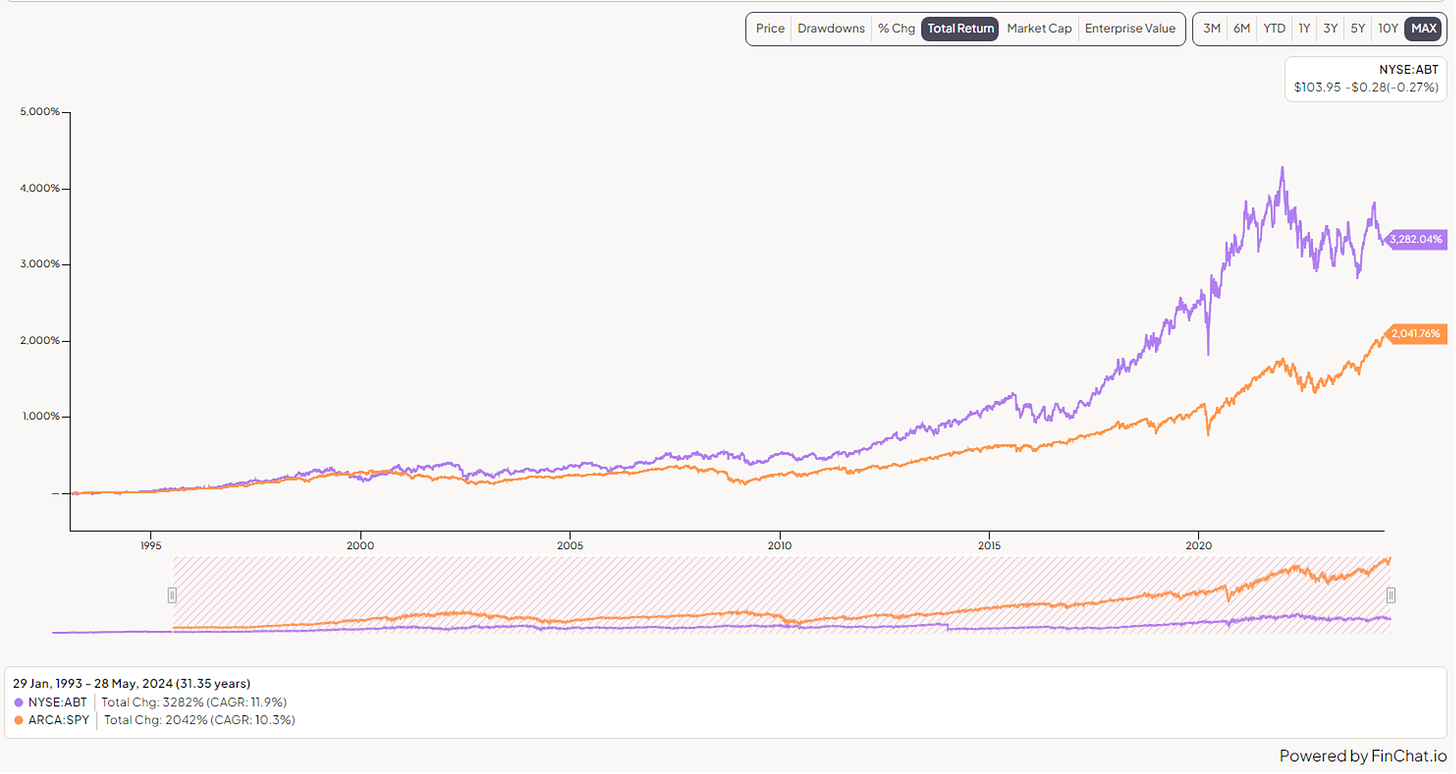
Ideally, the company has returned more than 12% per year to shareholders since its IPO. Because Abbott’s IPO was in 1929 and data that old is difficult to find and normalize to today, we’ll use a CAGR from 1990 instead.
Here’s what the performance of Abbott looks like:
YTD: -4%
5-year CAGR: +6.2% - With dividends reinvested: +8%
CAGR since 1990: +7.5%
CAGR since 1990 with dividends reinvested: +12.5% (CAGR since IPO > 12%? ✅)
Source: Finchat
That’s it for today
That’s it for today.
This was a guest post from TJ Terwilliger. Make sure to check out his Substack.
In case you missed it:
Used sources
Interactive Brokers: Portfolio data and executing all transactions
Finchat: Financial data





i really really really love the way you breakdown the thesis by your 16 points of quality, thank you!
Loved the systematic way you analysed the stock using your 18-20 valuation parameters. My question is - while analysing any stock, should we not also look at close competitors across the same valuation parameters and also do a macro analysis of the industry as a whole?